I am a scientist and engineer who loves working with big datasets 📡💾 and building unique applications 🏗️
This is just a small place for me to write about my experiences, past and current projects that I am working
on. 🚀
Click on the 🔽 in the sections below to read more.
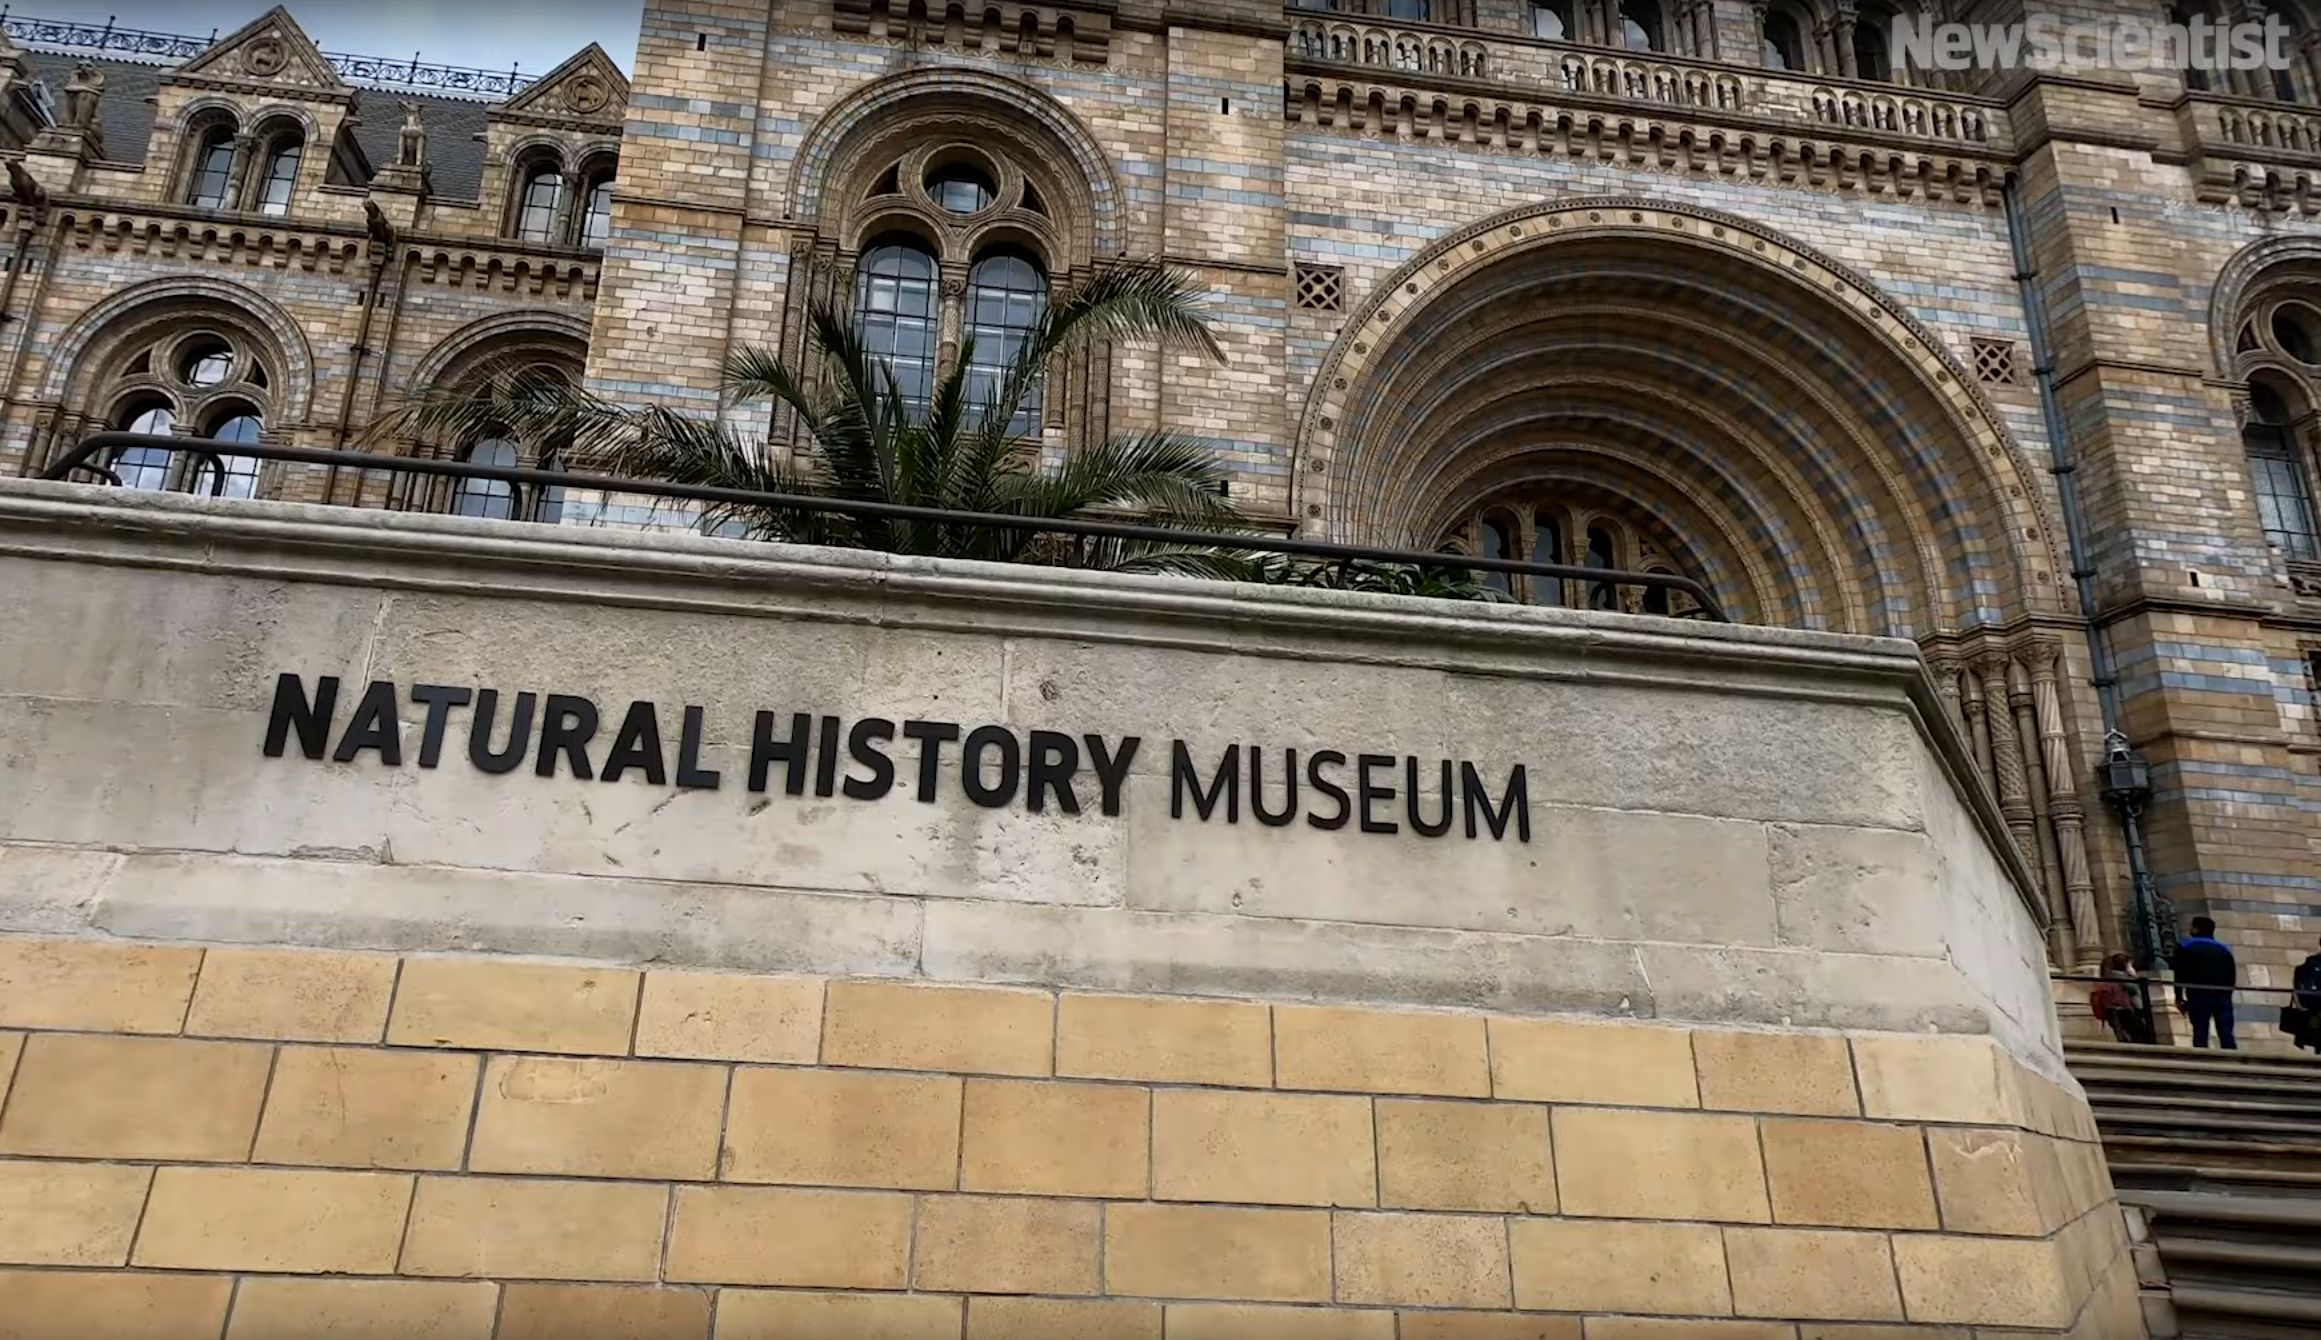
I've been very privileged to be able to work on the museum's Urban Nature Project and Data Ecosystem as a data engineer.
The Urban Nature Project (UNP) and Data Ecosystem (DE) are massive undertakings by the museum to convert
their South Kensington estate into a haven and sanctuary for urban wildlife. The Data Ecosystem
seeks to provide an automated system for recording wildlife observations as well as to empower people to
learn more about nature by participating in community and citizen science projects.
This has been a cross-disciplinary project working with academic researchers, citizen scientists, and
software engineers.
The aim of the project is to create a unified data warehouse and platform for collecting species
observations throughout the country as well as involving students and the general public in the museum's
science and academic research. Enabling a wider awareness of biodiversity and a love for nature.
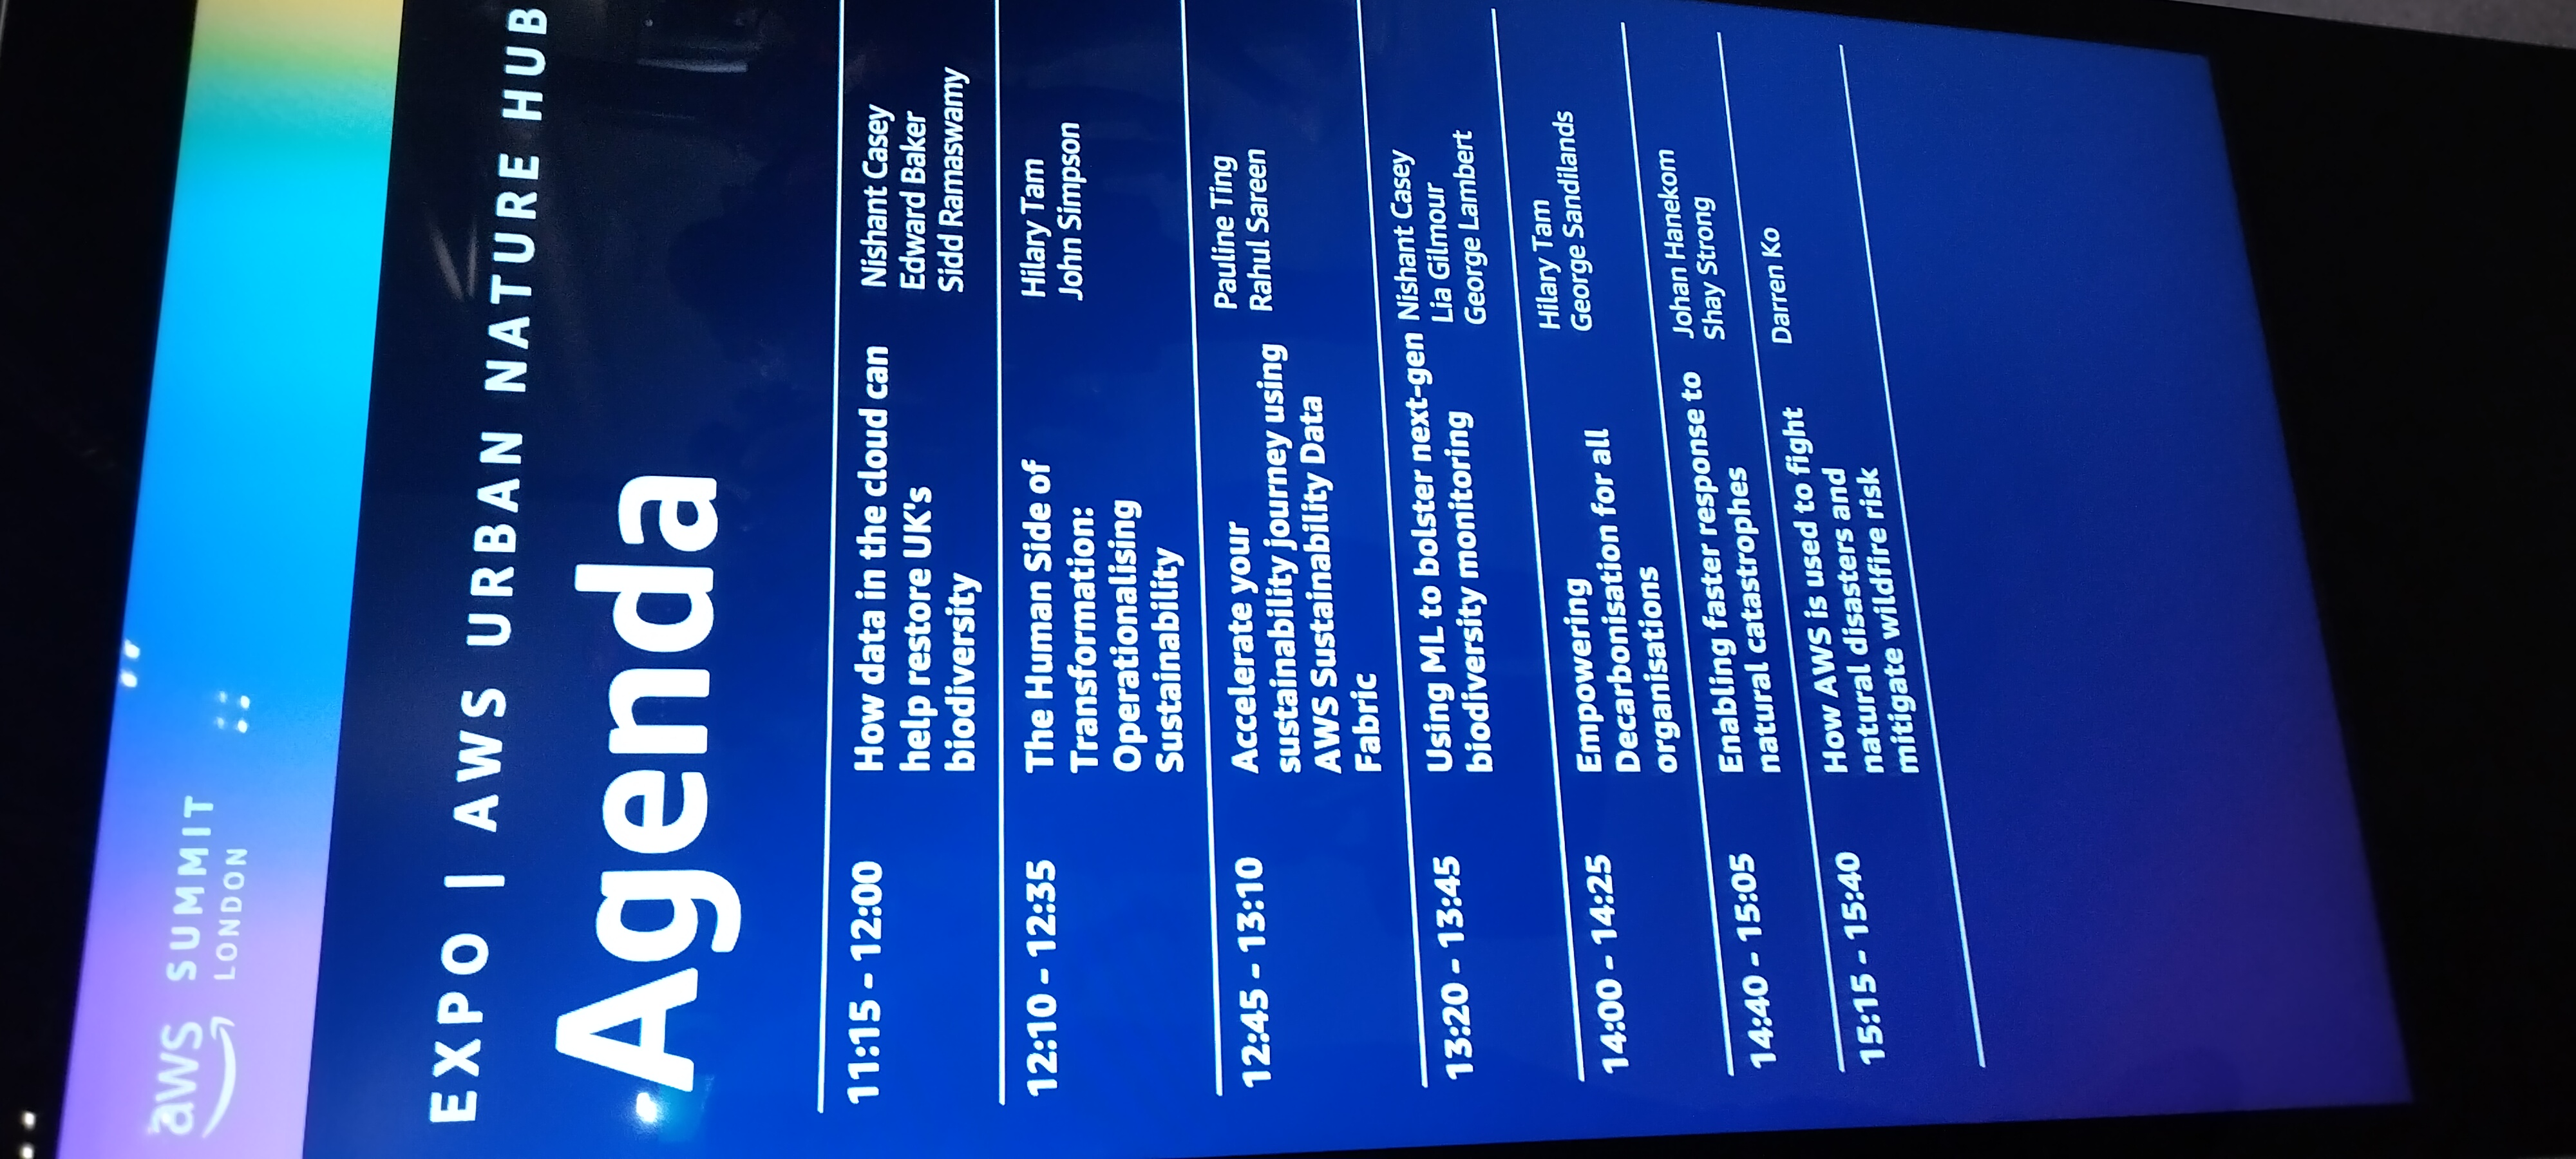
I was super excited to be given the opportunity to head to the AWS summit in London this year, to talk
about the museum's new "Data Ecosystem".
Fibre broadband companies deal largely with geospatial and address data. They need to be able to
accurately design new construction plans for their asset layouts.
Helping their site teams effectively manage the assets in the ground and their "digital twins".
A solid data engineering pipeline is required to effectively manage and the different data ingestion
sources for all parties; both customer, client and contrator.
Being predominantly geospatial, fibre cable diagrams are designed within a GIS (Geopgraphical Information
system). Yet, the customers and contractors require to know:
- If their house is connected to the company's fibre network.
- How many ports are available (not connected to an address) from any given fibre distribution point,
an underground cabinet or an aerial pole.
The GIS would contain the geospatial layout of the network, ideally within a database such as a PostgreSQL DB.
Yet, how can this be translated to an address? The answer is in geocoding! This is the "translation" of standard text to
Geopgraphical co-ordinates.
A simple demonstration of this in action is when the postman delivers a letter to your address using a
post code. Each post code is a polygon covering an area.
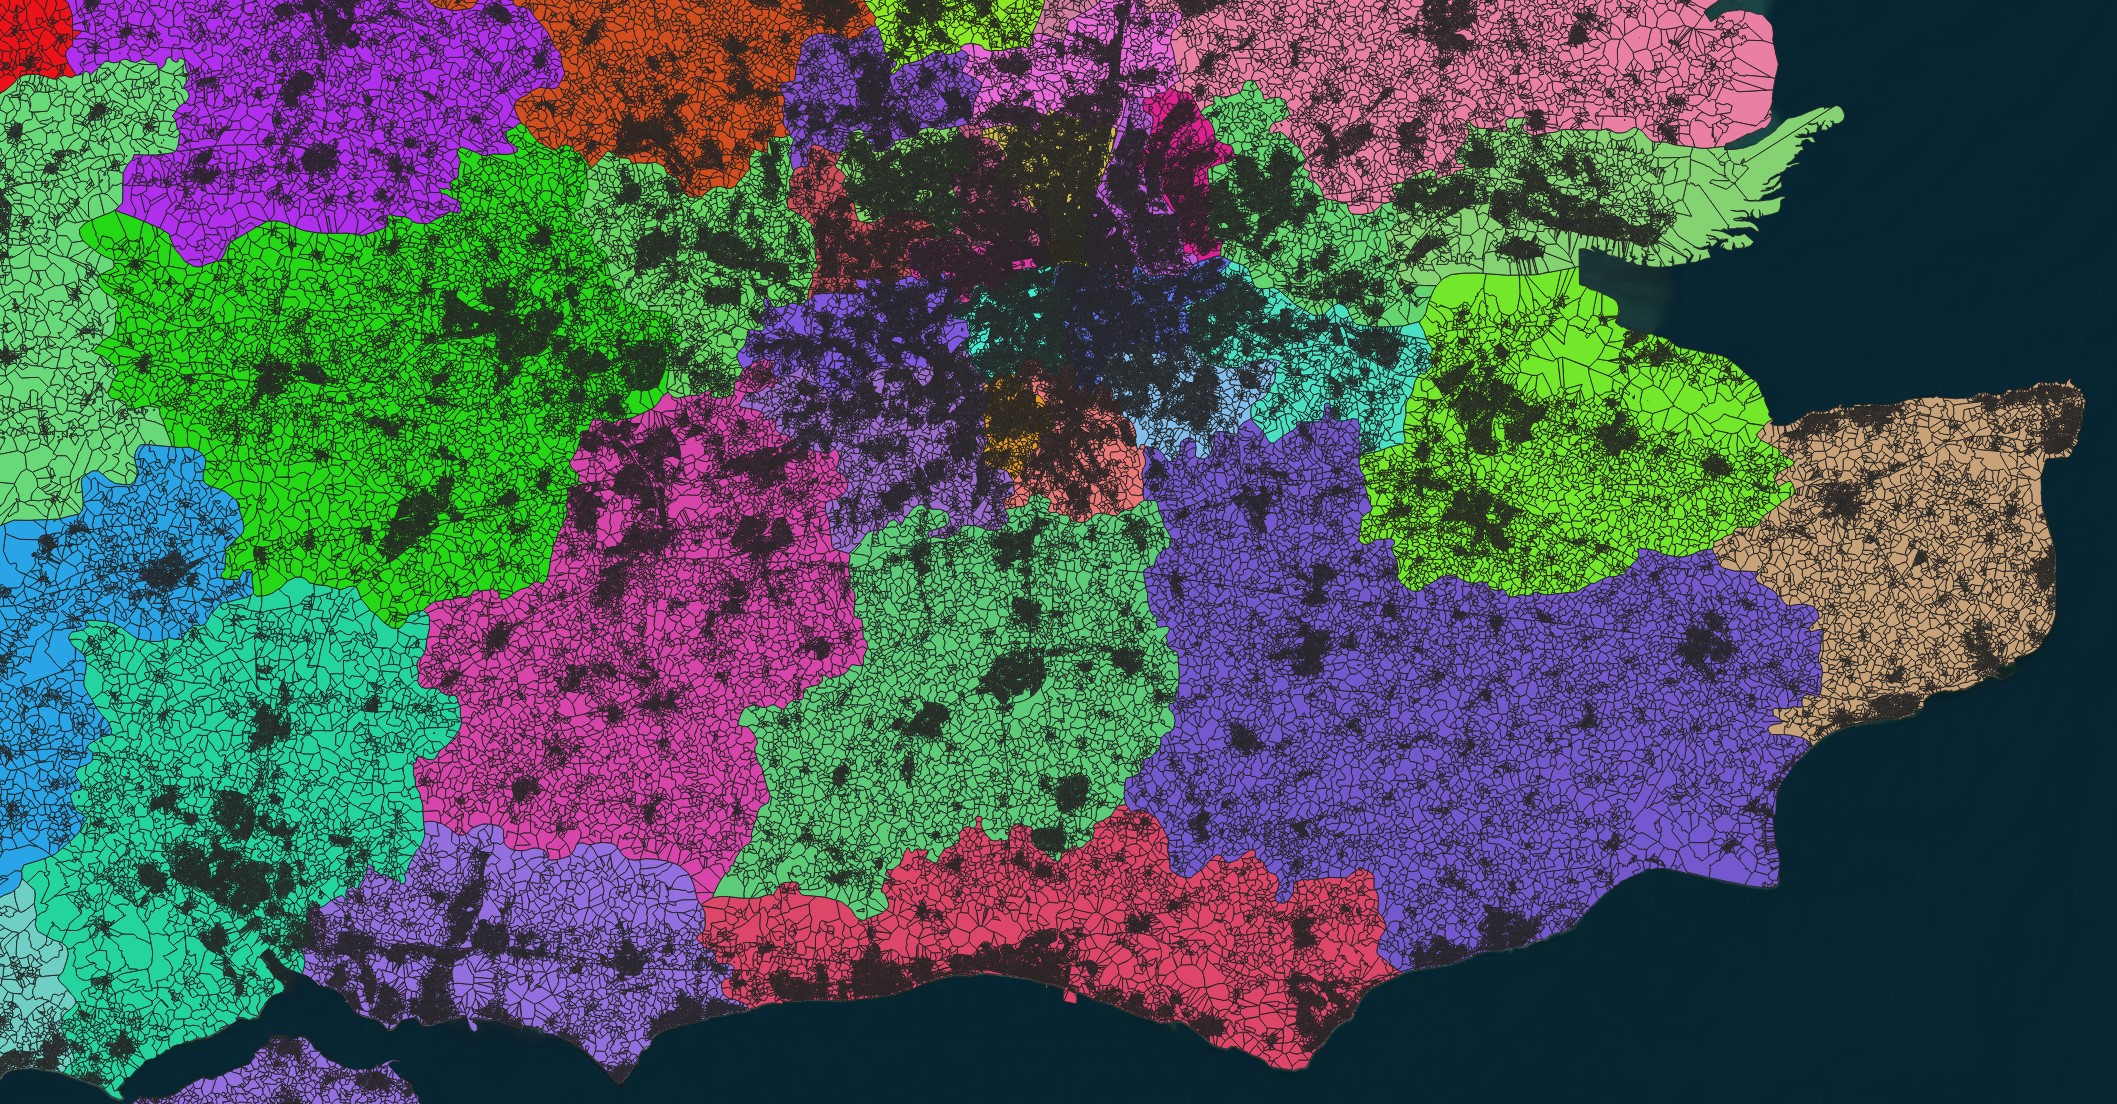
Above is a quick (and frankly quite heavy) visualisation of all the geocoded postcode boundaries in the
south east
The post code allows us to get the general area of an address, but we need to be a lot more specific than
that!
Thankfully, there are multiple methods to do so! In the UK, every physical address has been geolocated by
the Ordnance Survey and assigned a unique id called a "UPRN" (Unique Property Reference Number).
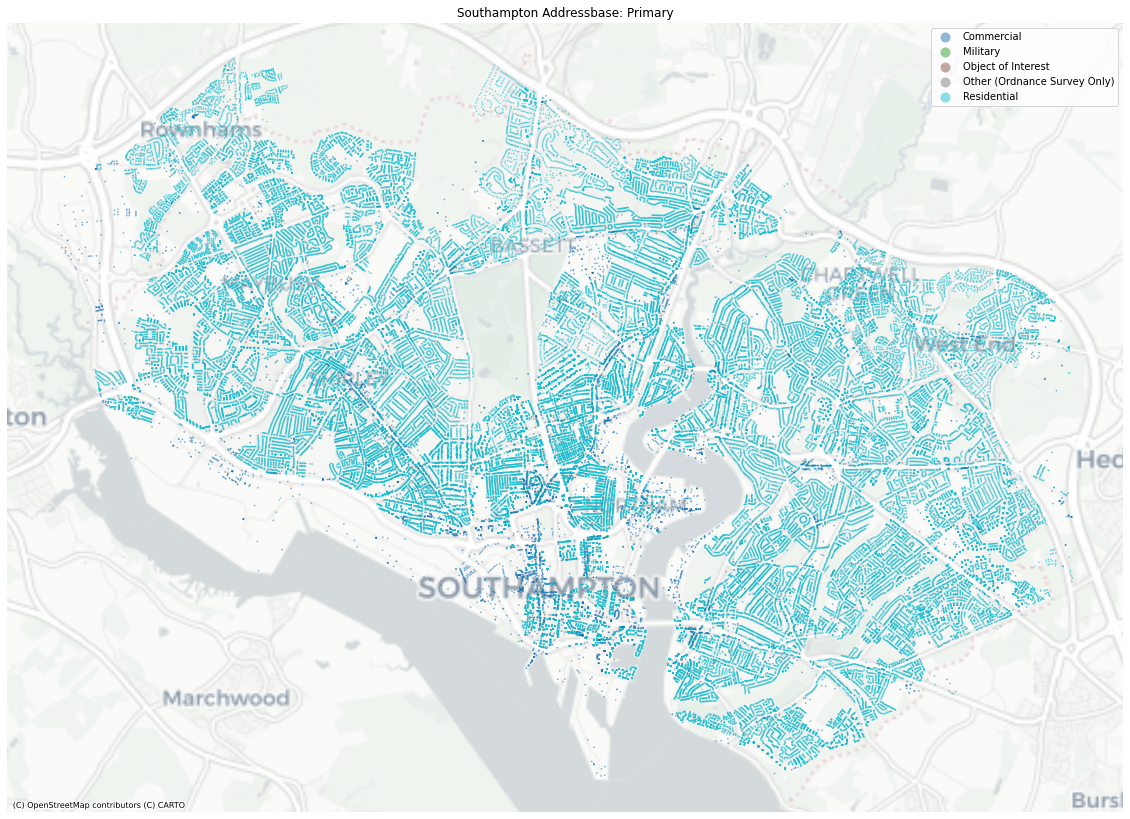
Above is an example of geocoded addresses plotted overa map of a city.
But what about addresses outside the UK? Google and What3Words provide a detailed grid covering the entire
world! Using their APIs, we can correlate any physical address with a square on their grids and
ultimately a latitude-longitude pair.
Now that we have connected our fibre asset database with our customer addresses, we just need to let the
sales team know which addresses the engineers have connected up and marked as ready for sale.
Marketing teams use software called a "CRM" (Customer Relationship Management). These are large databases
containing sensitive customer contact details, payment information and chat logs, for example; salesforce
Site asset maintainence teams generally use some form of project management software like monday.com or Jira.
An effective data pipeline would need to ingest both the geospatial asset data, text address and customer
management data as well as the contractors' management system data.
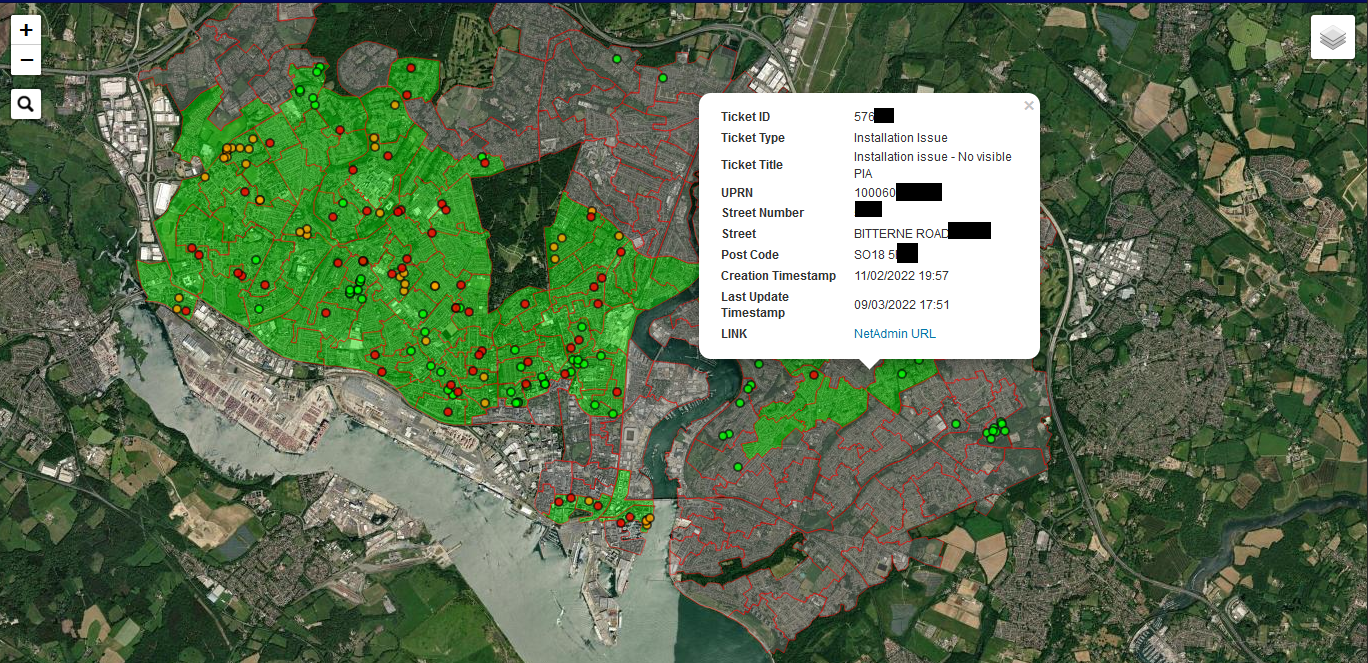
Above is an example dashboard combining CRM, address and fibre asset data, illustrating properties
connected to the network and those requiring connection along with notes, issues and comments
highlighted by the customer relationship management software.
An interesting phase of my career was working as a GIS data team lead for architectural and urban
planning projects in Saudi Arabia.
This involved acquiring different datasets for analysis to inform the design of new developments in the
Riyadh, Al Ula Al Soudah and Neom regions.
Urban designs and real world datasets were ingested into digital twin data models of the developments.
These were then used to predict livability scores for environmental, commutability and heritage factors.
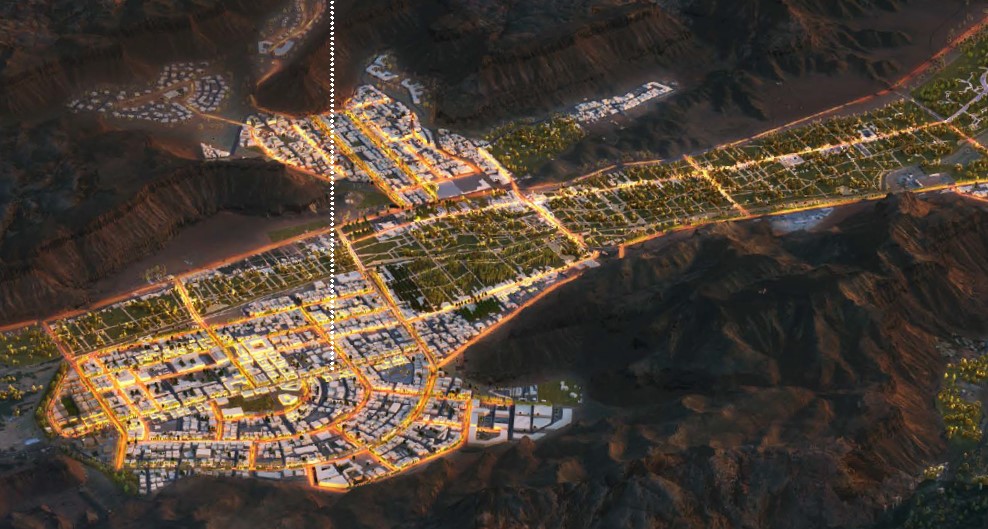
A still render of an urban digital twin model.
Working offshore did have its advantages. The main point was being away for extended periods of time.
I would like to think that most of this time was just spent "travelling", living the
"Instagram" lifestyle. However, in reality I was stuck in the middle of the sea in an old and
rusty survey ship, monitoring a big screen collecting data from the seafloor.
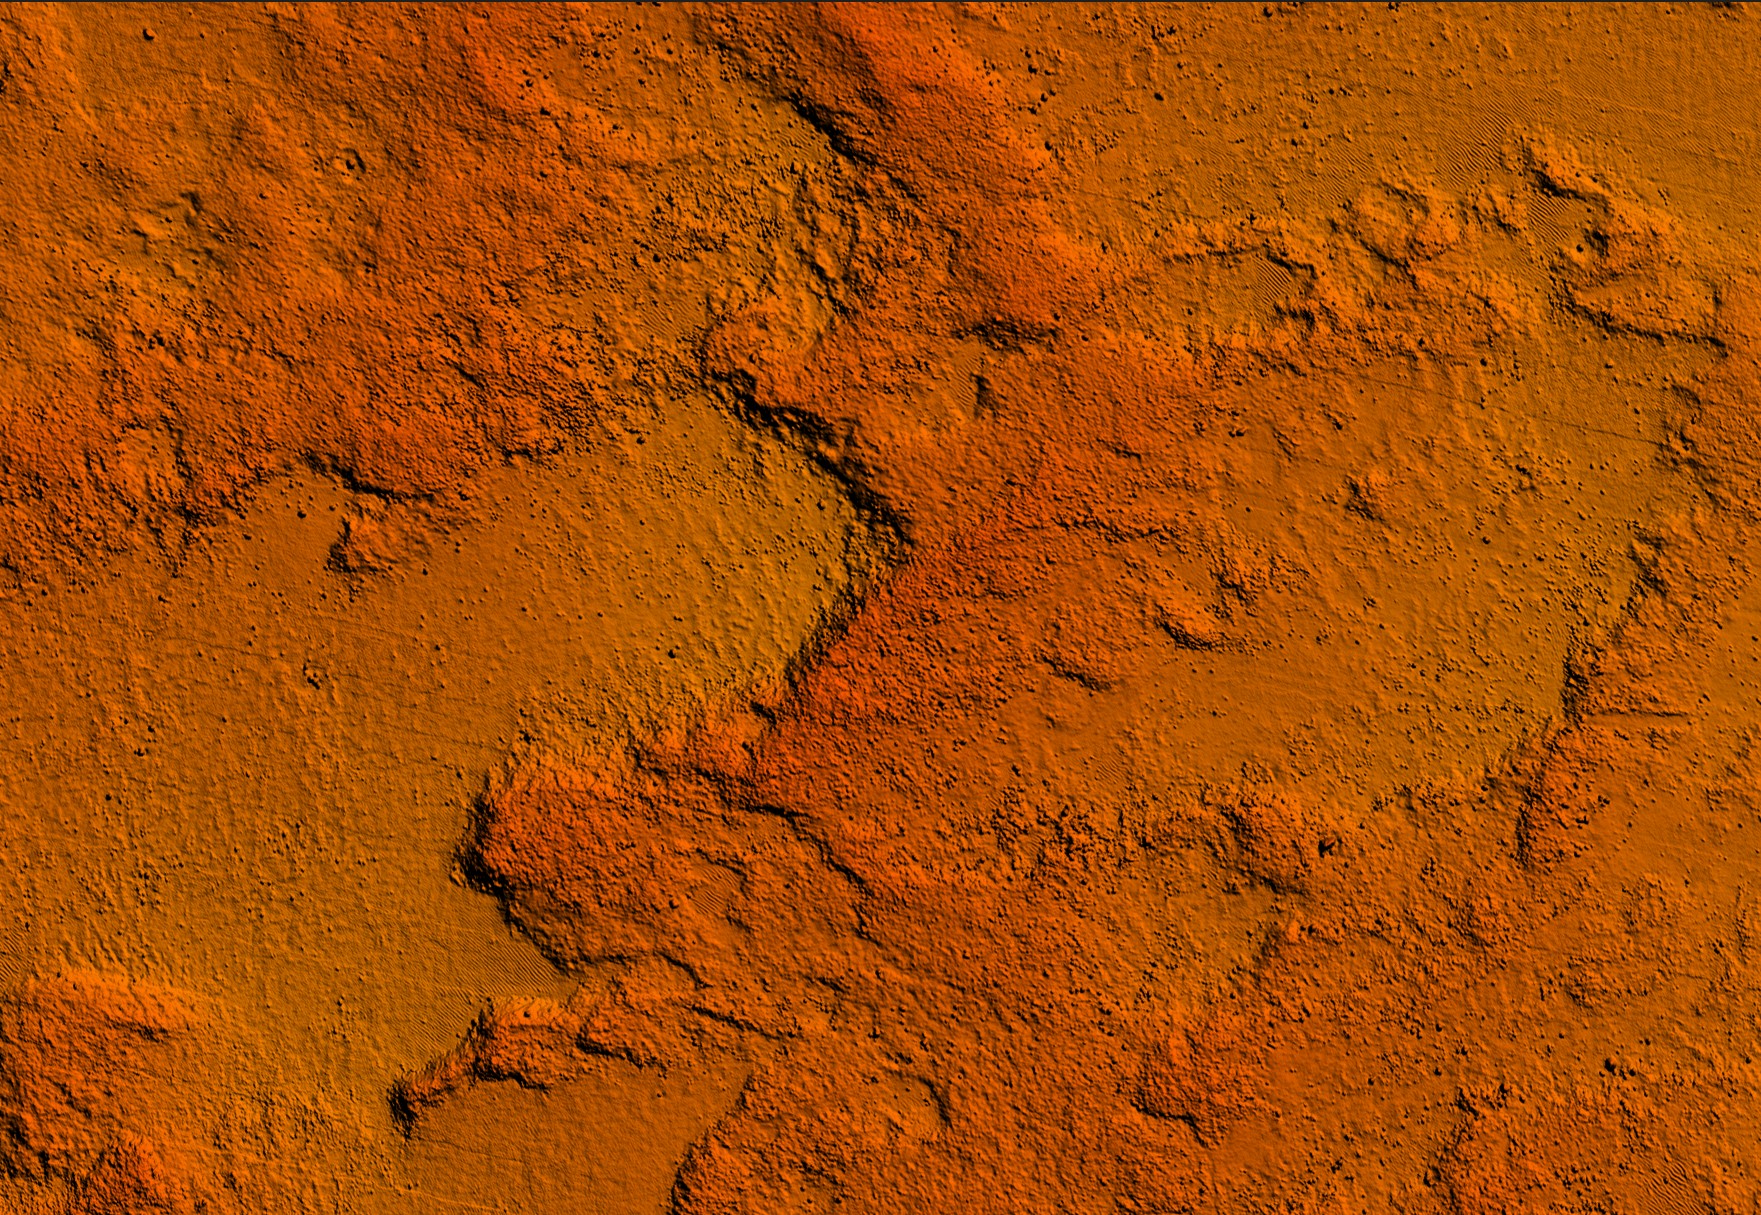
Literally the sea floor as seen from shipping echosounder somewhere in the middle of the Norwegian sea.
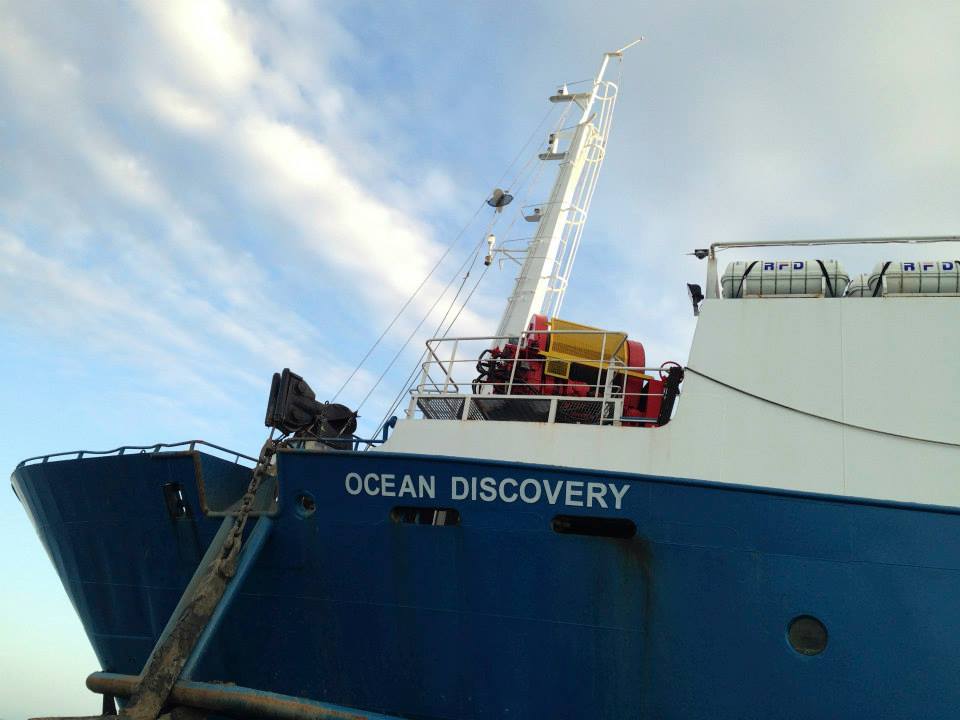
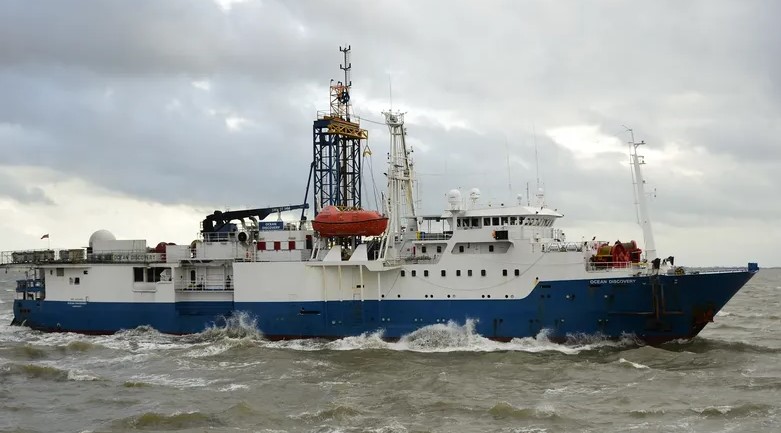
Some glamour shots of my old ship; the M.V. Ocean Discovery, that has taken me on many an adventure!
The client companies financing the surveys were predominantly Oil and Gas firms or Wind farm construction
firms looking to get a better understanding of where to construct their infrastructure.
My role on the ships was, as much of the marine staff would like to joke; "lab rat". More
seriously though, as the geoscientist on board, I was tasked with collecting the sensor data and then to
building machine learning image classification models to detect features.
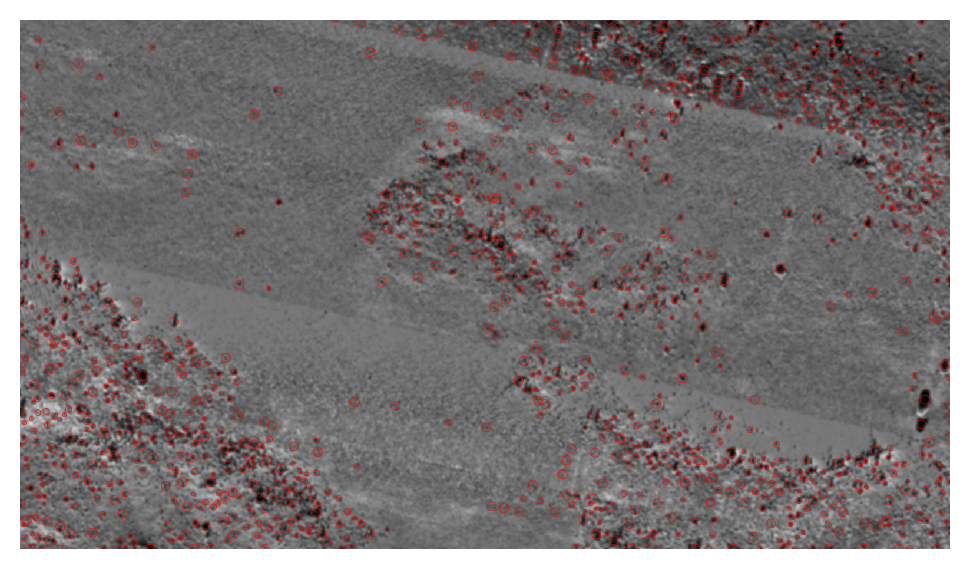
An example of using an image classification ML model to detect features (likely large rocks) on the
seafloor
These models were used to determine the risk of damage to underwater infrastructure.
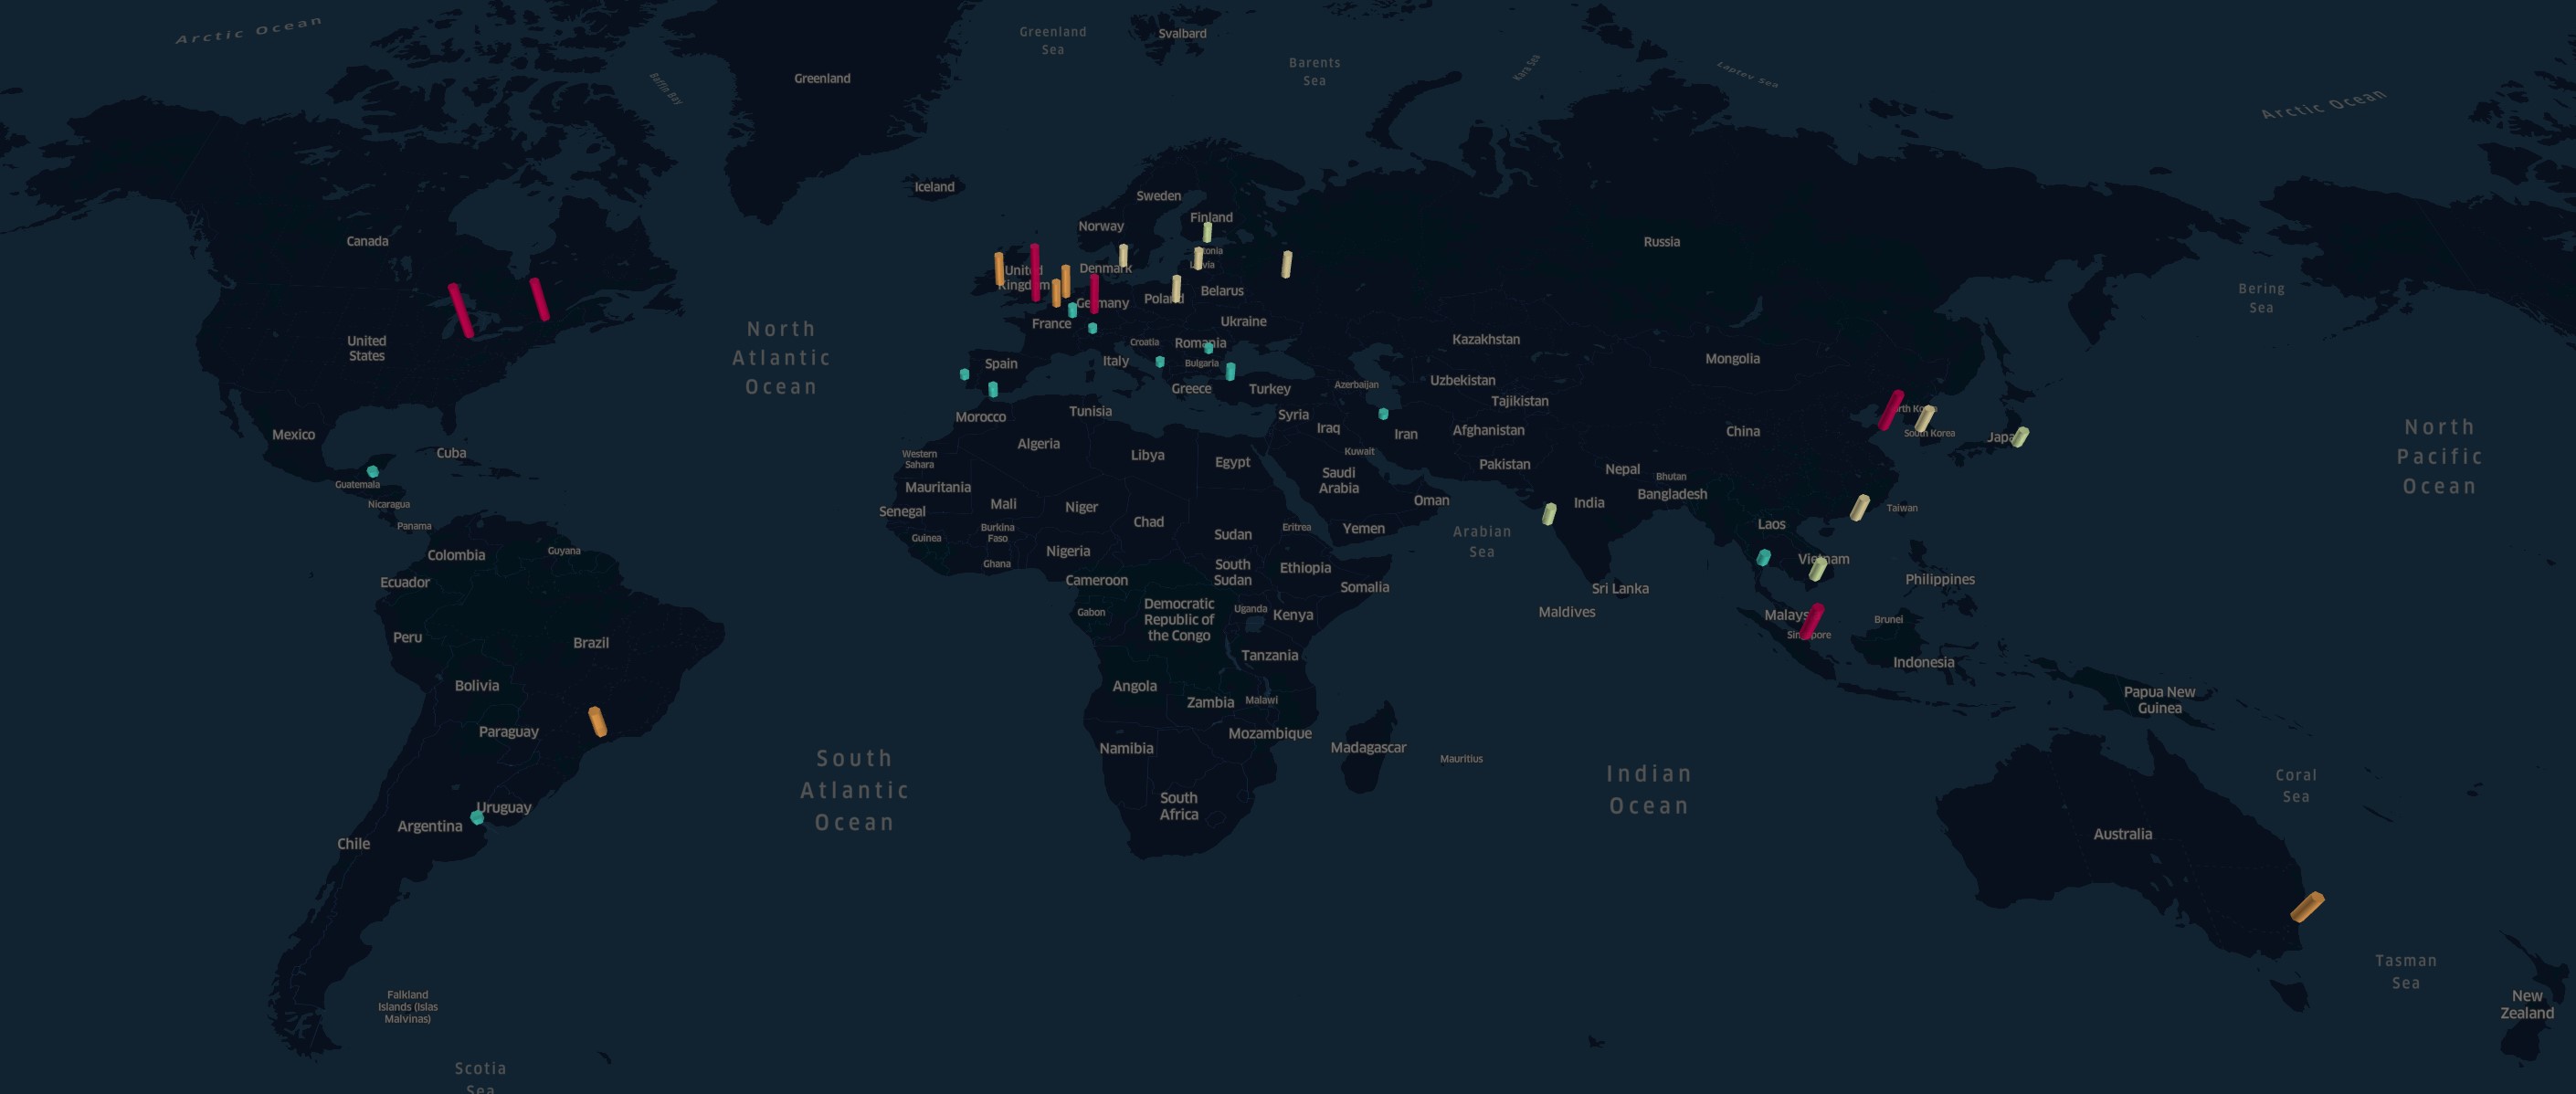
All ships are equipped with an "Automatic Identification System". This AIS data can be used to track the known
location of any marine vessel at any given time.
This data can then be used to predict ship locations near underwater assets (like pipelines and
windfarms) and predict any risk of damage due to collision, anchor scour etc...
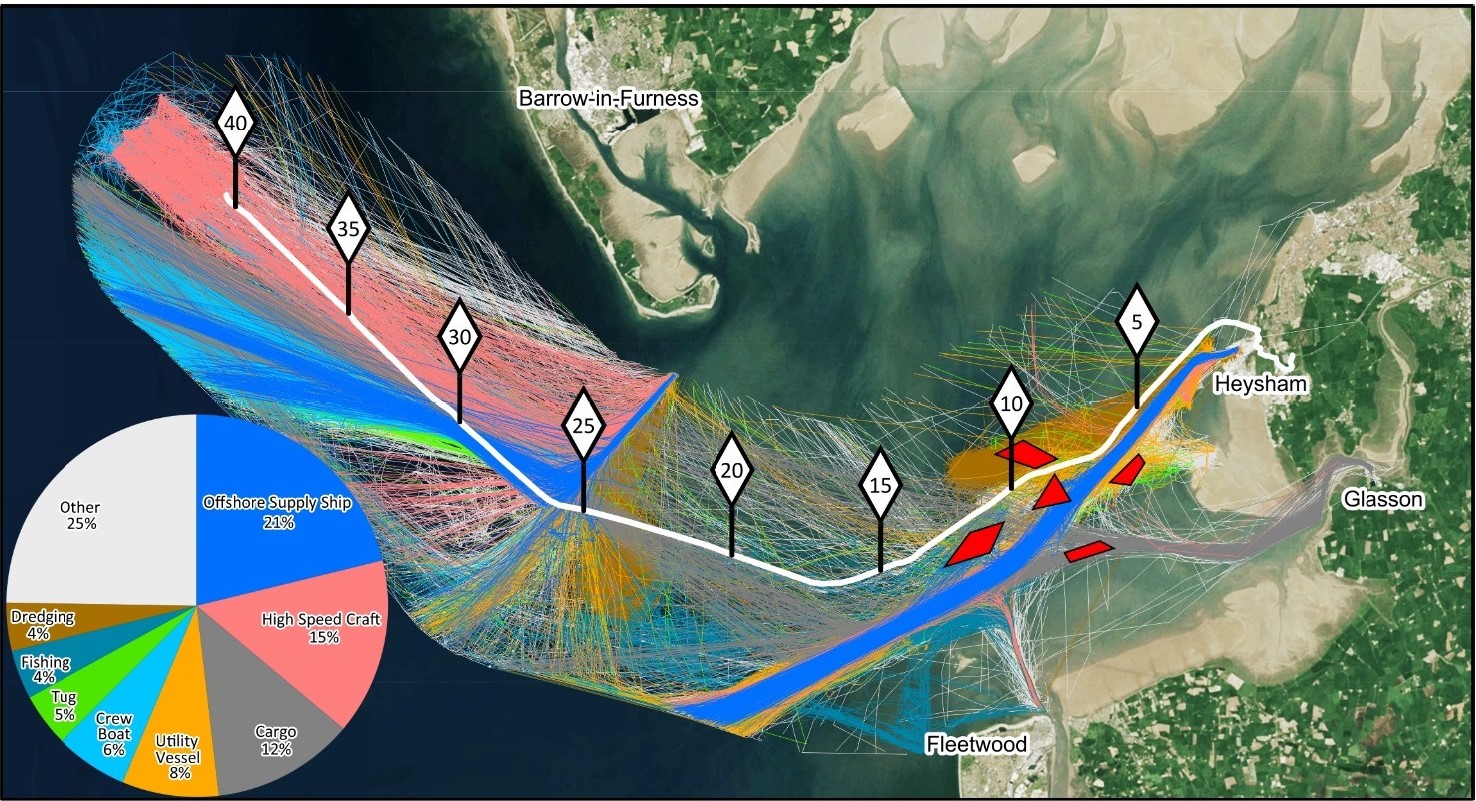
Example AIS data showing shipping activity near a cable pipeline and likely high risk areas.
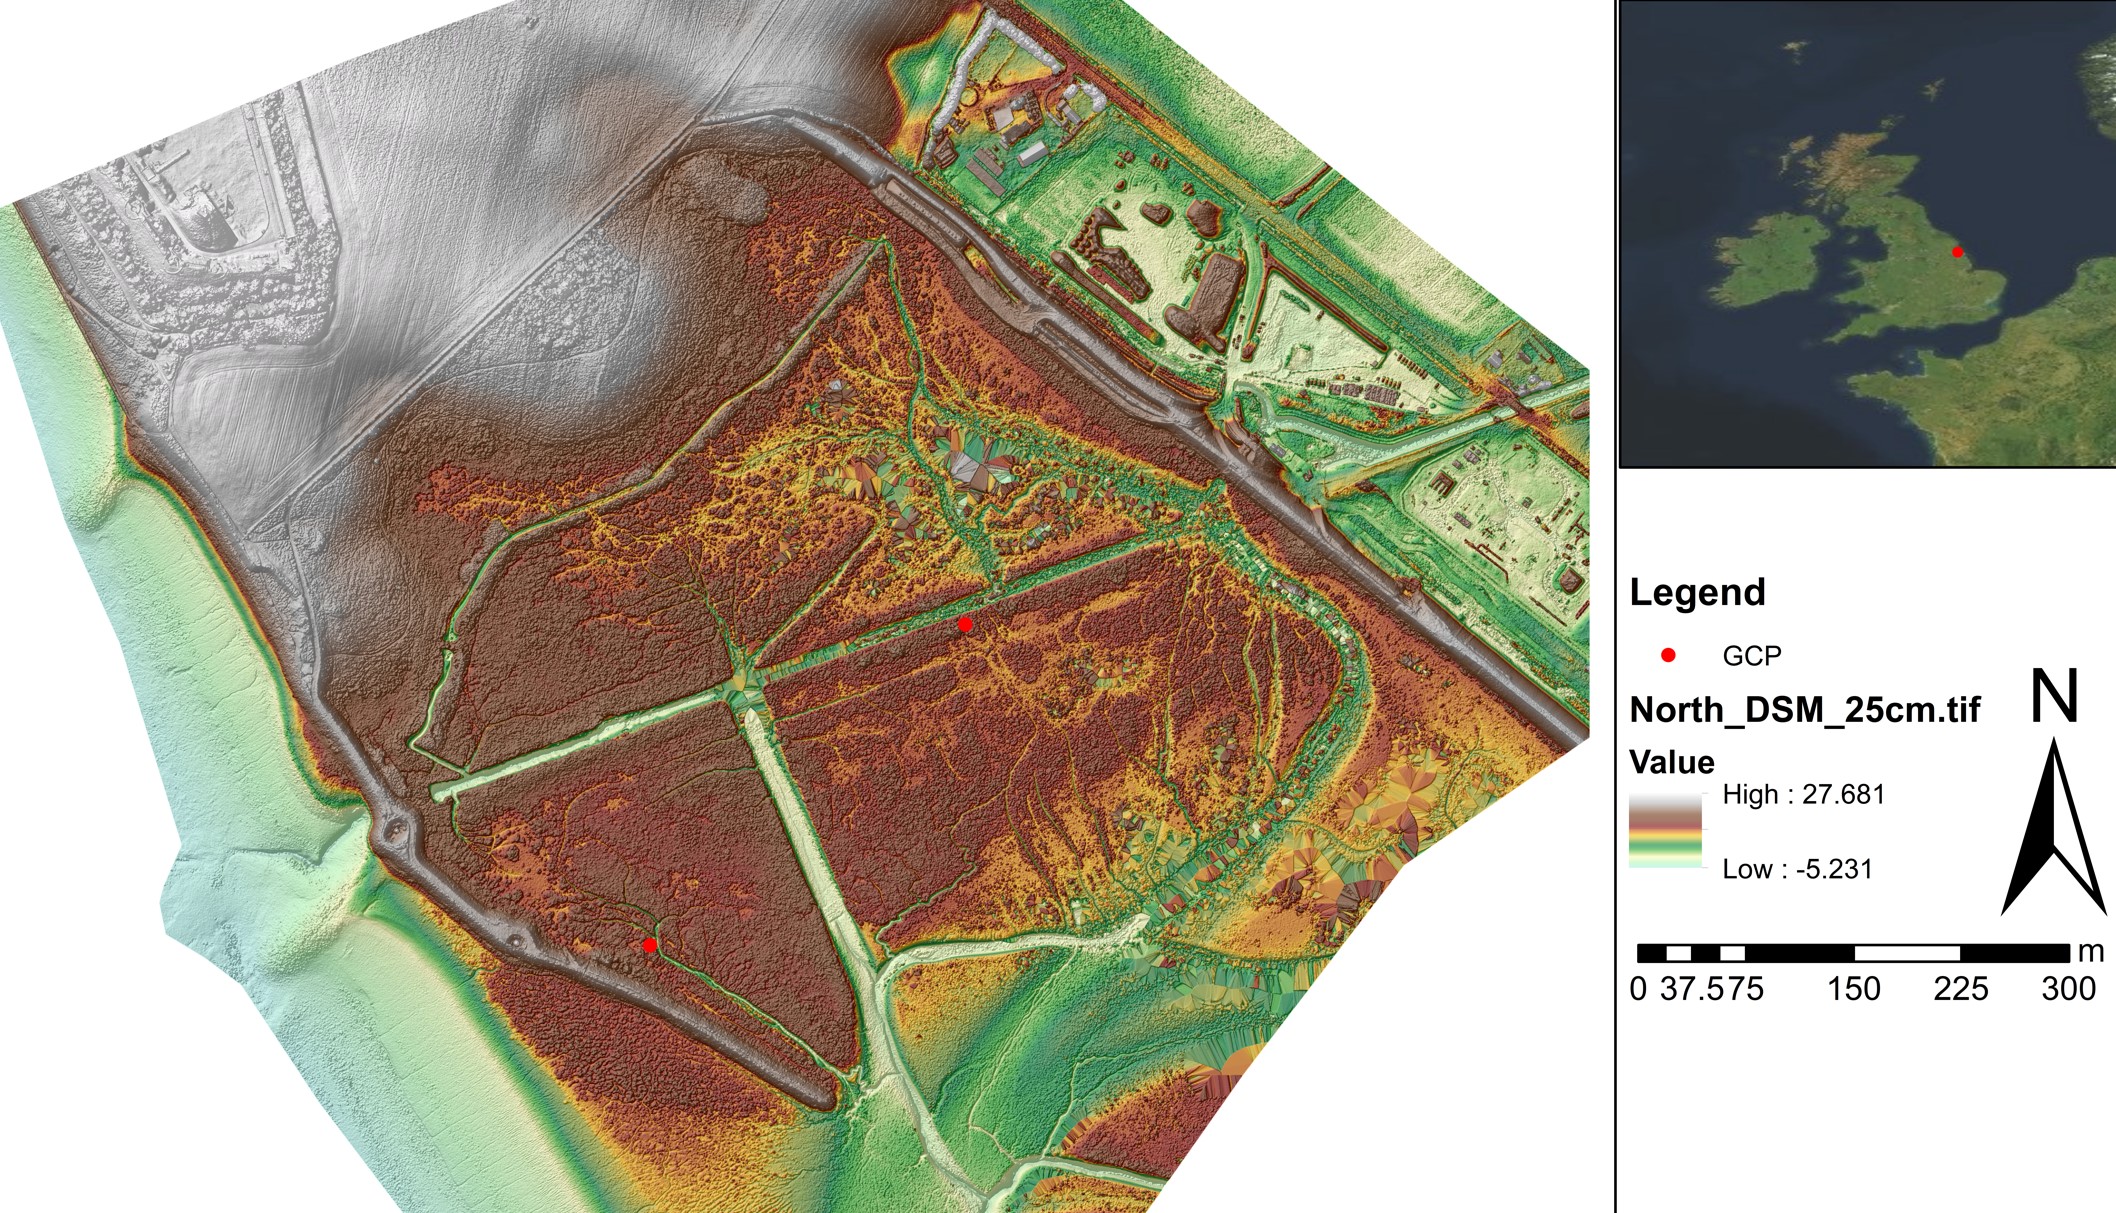
The same offshore data collection and analysis methods can be applied to land-based aerial surveys using
Unmanned Aerial Vehicles (UAV/drones).
Below is an example of data collected from a drone flight being used to plot a digital elevation model of
an area.